Postgresql HA
Solution choice
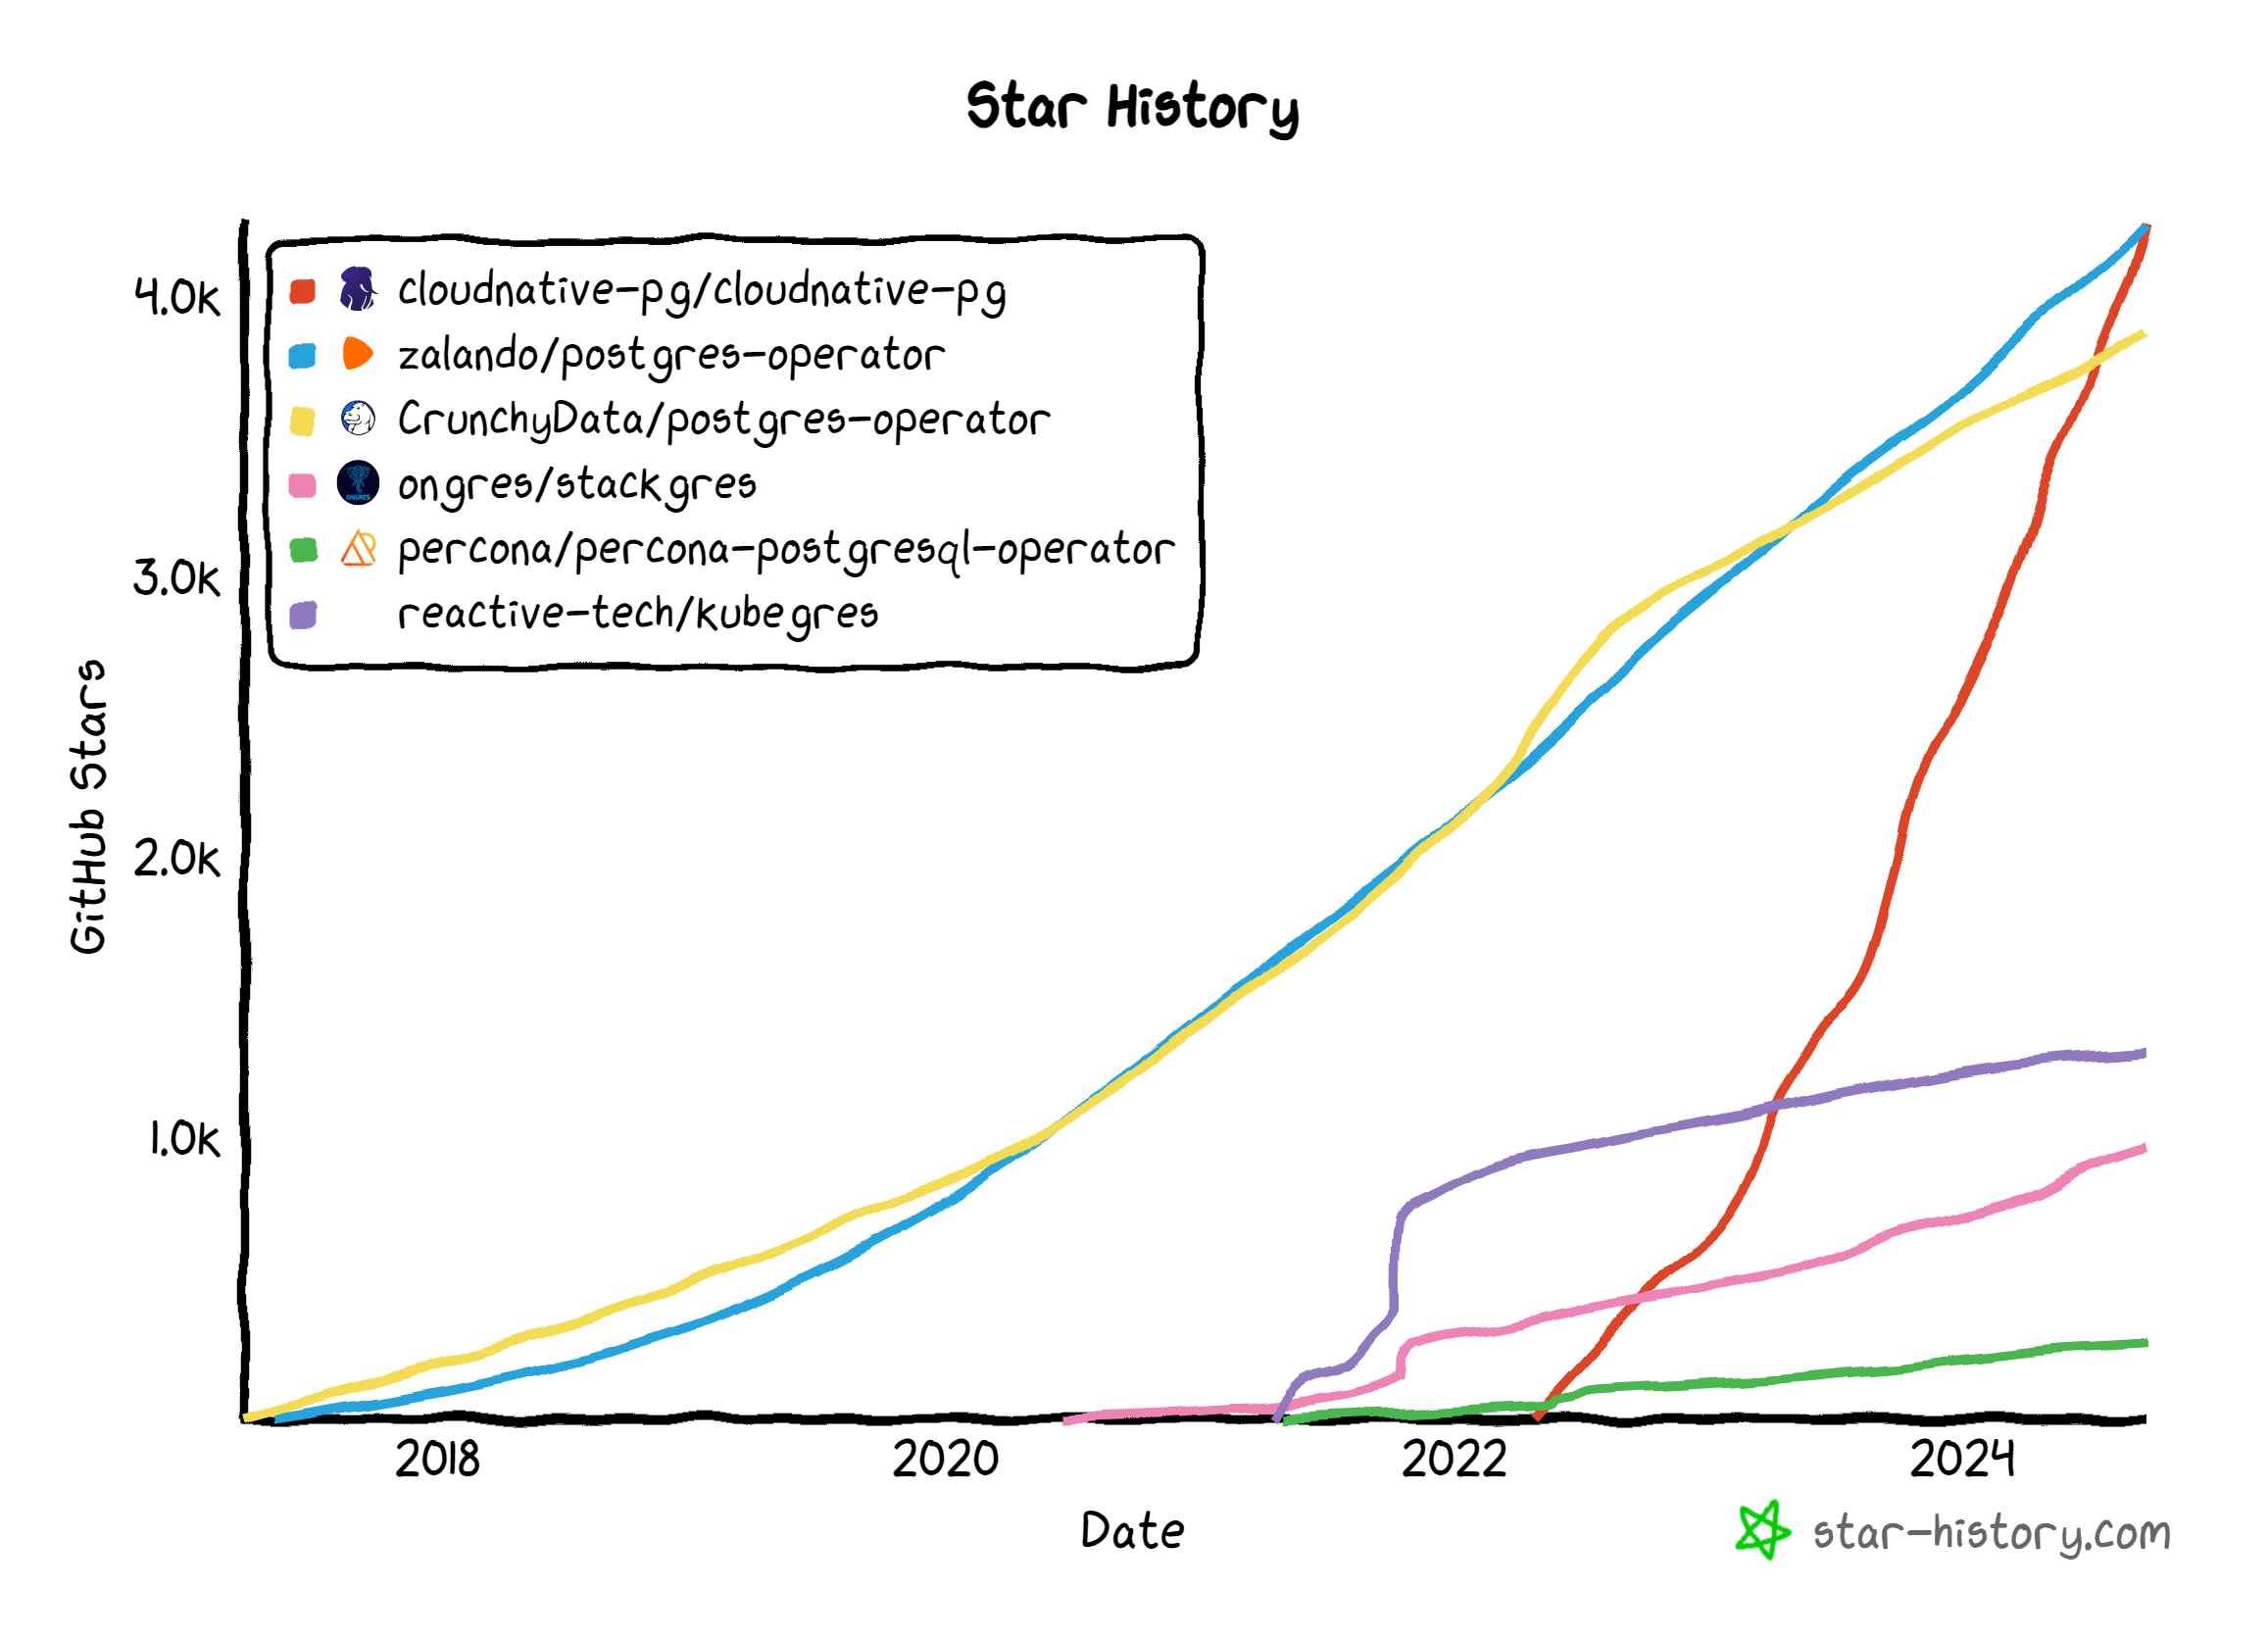
cloudnative-pg/cloudnative-pg: CloudNativePG is a comprehensive platform designed to seamlessly manage PostgreSQL databases within Kubernetes environments, covering the entire operational lifecycle from initial deployment to ongoing maintenance
Active community, high stars, fancy solution, tailored for K8s. An introduction:
4,300 GitHub Stars and Counting: CloudNativePG Now the World’s #1 PostgreSQL Operator for Kubernetes
Installation
Installation by Helm: cloudnative-pg/charts: CloudNativePG Helm Charts
While we are installing cnpg/cloudnative-pg Chart with version 0.22.1, it refers to the app version to be 1.24.1 , which defaults to PG 17.0.
17.0 this version seems to be some bugs:
[Bug]: Primary PostgreSQL Instance Not Gracefully Shutting Down and Missing WAL File · Issue #3680 · cloudnative-pg/cloudnative-pg
That cause the replicas fail to finish WAL archiving(which misses a few WALs) when doing a backup after a failover on the primary. So we have to specify the docker image tag to 17.2.
As we use Incubator to create k8s manifests through helm releases, you should follow the syntax to define the resources. Here’s an example to install the cluster:
resources:
- apiVersion: postgresql.cnpg.io/v1
  kind: Cluster
  metadata:
    name: postgresql
  spec:
    imageName: ghcr.io/cloudnative-pg/postgresql:17.2
    instances: 3

    storage:
      storageClass: local-path # we use local-path-provisioner to provisioning storage
      size: 300Gi

    monitoring:
      enablePodMonitor: true # enable podmonitor, which will instructs promethues to crawle the metrics from pg

    backup:
      barmanObjectStore:
        destinationPath: s3://bucket_name/a/b/c
        endpointURL: https://fsn1.your-objectstorage.com # we use Hetzner Cloud Object Storage
        s3Credentials:
          accessKeyId:
            name: backup-creds
            key: ACCESS_KEY_ID
          secretAccessKey:
            name: backup-creds
            key: ACCESS_SECRET_KEY
          region:
            name: backup-creds
            key: REGION # defaults to fsn1
        wal:
          compression: gzip
          encryption: # Hetzner doesn't support encryption at this time, so we have to disable it
        data:
          compression: gzip
          encryption:
          immediateCheckpoint: false
          jobs: 8
      retentionPolicy: "7d" # keep last 7 days backups
- apiVersion: postgresql.cnpg.io/v1
  kind: ScheduledBackup
  metadata:
    name: backup-schedule
  spec:
    immediate: true
    schedule: "0 0 * * * *" # back up every hour
    backupOwnerReference: self
    cluster:
      name: postgresql
Don’t forget to create a K8s secret named backup-creds which contains the Object Storage Access Key and Access Secret and then create this helm release.
Configuration
The configurations are shown in the above vaules file, we can go a little bit further to figure things out.
Replication
The architecture is one Primary two Secondary. At every point of time we will only get one primary which is responsible for read/write requests, while the Secondary accepts read queries only. We can use postgresql-rw to connect to the Primary while using postgresql-ro to connect to the Secondaries.
Failover
Find if there are any lags from stats:
select * from pg_stat_wal_receiver;
Or we can directly go to the Grafana Dashboard and watch if there’s any lags on the Secondary.
If the Primary crashes(like Disk Corruption), the controller will detect it goes down, then it will trigger another Election that promote one Secondary to Primary. After the Primary recovers, it will be downgraded to Secondary and resync from the new Primary.
Backup
While we host our own K8s cluster on Bare Metals so there’s no way to utilize the Volume Snapshot function. Therefore, we choose to use Hetzner Object Storage as our backup source.
One point is that the endpointURL should be like https://fsn1.your-objectstorage.com but not the AWS style https://bucket.region.xxxx.yyyy , the other is that the encryption should be null if you are using Hetnzer Object Storage(although they said that it’s S3 compatible but it’s not totally the same as AWS S3). If you are intended to use AWS S3, then forget about my words.
Recovery
If you want recovery from a backup, then the cluster values show be like this:
resources:
- apiVersion: postgresql.cnpg.io/v1
  kind: Cluster
  metadata:
    name: cluster-restore
  spec:
    imageName: ghcr.io/cloudnative-pg/postgresql:17.2
    instances: 3
    storage:
      storageClass: local-path
      size: 300Gi
    bootstrap:
      recovery:
        source: postgresql
        targetTime: "2024-12-10 08:35:50.00000+00" # although this field should work to do a Point-In-Time Recovery, but I failed to get it work. Have no idea, if you know how to, please let me know.
    externalClusters:
      - name: postgresql
        barmanObjectStore:
          destinationPath: s3://bucket_name/a/b/c
          endpointURL: https://fsn1.your-objectstorage.com
          s3Credentials:
            accessKeyId:
              name: backup-creds
              key: ACCESS_KEY_ID
            secretAccessKey:
              name: backup-creds
              key: ACCESS_SECRET_KEY
            region:
              name: backup-creds
              key: REGION
          wal:
            maxParallel: 8
The bootstrap.recovery.source should be the same as externalClusters[*].name so that controller can find corelated cluster and backup to recover. Then it will create a brand new cluster named cluster-restore with all the backup data and permissions. To be noticed, the bootstrap.recovery is mutal with backup.
Monitoring
How to install Prometheus Stack is beyond the scope of this post. Clounative-pg offers one out-of-box Grafana Dashboard where we can easily find out the running status and stats of this pg cluster. We can enable PodMonitor on installation and then import the Grafana Dashboard, then wait for a moment, the dashboard should be all right.
resources:
- apiVersion: postgresql.cnpg.io/v1
  kind: Cluster
  metadata:
    name: postgresql
  spec:
    ...
    monitoring:
      enablePodMonitor: true # enable podmonitor, which will instructs promethues to crawle the metrics from pg
Benchmark
We are using pgbench, a performance testing tool specifically for PostgreSQL, to perform stress tests. pgbench is geared towards evaluating performance through Transactions Per Second (TPS). The scope of this discussion is limited to TPS testing with pgbench and will not address Queries Per Second (QPS) measurements.
All the tests were conducted under the instructions of Official Docs.
The machine spec is 128G memory, AMD 7950 X3D and we didn’t set resource limits on the instances so the Qos should be Burstable.
Generate a datbase with 100000000 records
kubectl cnpg pgbench \
  --job-name pgbench-init \
  cluster-example \
  -- --initialize --scale 1000

99900000 of 100000000 tuples (99%) of pgbench_accounts done (elapsed 50.99 s, remaining 0.05 s)
100000000 of 100000000 tuples (100%) of pgbench_accounts done (elapsed 51.05 s, remaining 0.00 s)
vacuuming...
creating primary keys...
done in 68.58 s (drop tables 0.00 s, create tables 0.02 s, client-side generate 51.11 s, vacuum 0.16 s, primary keys 17.28 s).
1 Clinent, 1 Thread
$ kubectl cnpg pgbench \
  --job-name pgbench-run \
  postgresql \
  -- --time 30 --client 1 --jobs 1

$ kubectl logs -f jobs/pgbench-run

pgbench (17.2 (Debian 17.2-1.pgdg110+1))
starting vacuum...end.
transaction type: <builtin: TPC-B (sort of)>
scaling factor: 1000
query mode: simple
number of clients: 1
number of threads: 1
maximum number of tries: 1
duration: 30 s
number of transactions actually processed: 3535
number of failed transactions: 0 (0.000%)
latency average = 8.484 ms
initial connection time = 13.850 ms
tps = 117.872101 (without initial connection time)
10 Clients, 1 Threa
$ kubectl cnpg pgbench \
  --job-name pgbench-run \
  postgresql \
  -- --time 60 --client 10 --jobs 1

$ kubectl logs -f jobs/pgbench-run

pgbench (17.2 (Debian 17.2-1.pgdg110+1))
starting vacuum...end.
transaction type: <builtin: TPC-B (sort of)>
scaling factor: 1000
query mode: simple
number of clients: 10
number of threads: 1
maximum number of tries: 1
duration: 60 s
number of transactions actually processed: 558157
number of failed transactions: 0 (0.000%)
latency average = 1.074 ms
initial connection time = 38.780 ms
tps = 9308.454464 (without initial connection time)
30 Clients, 10 Threads
$ kubectl cnpg pgbench \
  --job-name pgbench-run \
  postgresql \
  -- --time 60 --client 30 --jobs 10
$ kubectl logs -f jobs/pgbench-run

pgbench (17.2 (Debian 17.2-1.pgdg110+1))
starting vacuum...end.
transaction type: <builtin: TPC-B (sort of)>
scaling factor: 1000
query mode: simple
number of clients: 30
number of threads: 10
maximum number of tries: 1
duration: 60 s
number of transactions actually processed: 239103
number of failed transactions: 0 (0.000%)
latency average = 7.526 ms
initial connection time = 26.742 ms
tps = 3986.131637 (without initial connection time)
| Clients | Threads | Transactions | Latency (ms) | TPS |
|---|---|---|---|---|
| 1 | 1 | 3535 | 8.484 | 117.87 |
| 10 | 1 | 558157 | 1.074 | 9308.45 |
| 30 | 10 | 239103 | 7.526 | 3986.13 |
In summary, PostgreSQL is proving to be a highly performant database, delivering excellent read-write capabilities. The fact that it can handle high concurrency requests while maintaining near 4000 TPS with only 3 CPUs (using 30 clients and 10 threads) demonstrates its remarkable performance.